5S Audit Excel Template
In the quest for operational excellence and productivity, businesses across diverse industries are turning to methodologies like 5S to streamline processes and optimize workspace utilization.…

In the quest for operational excellence and productivity, businesses across diverse industries are turning to methodologies like 5S to streamline processes and optimize workspace utilization.…

Organizations are constantly seeking methods to enhance efficiency, foster innovation, and resolve challenges effectively. One powerful tool that has emerged as a cornerstone in this…

Failure Mode Effects and Analysis (FMEA) is a powerful tool embraced by industries worldwide to predict and mitigate potential failures within systems, products, or processes.…
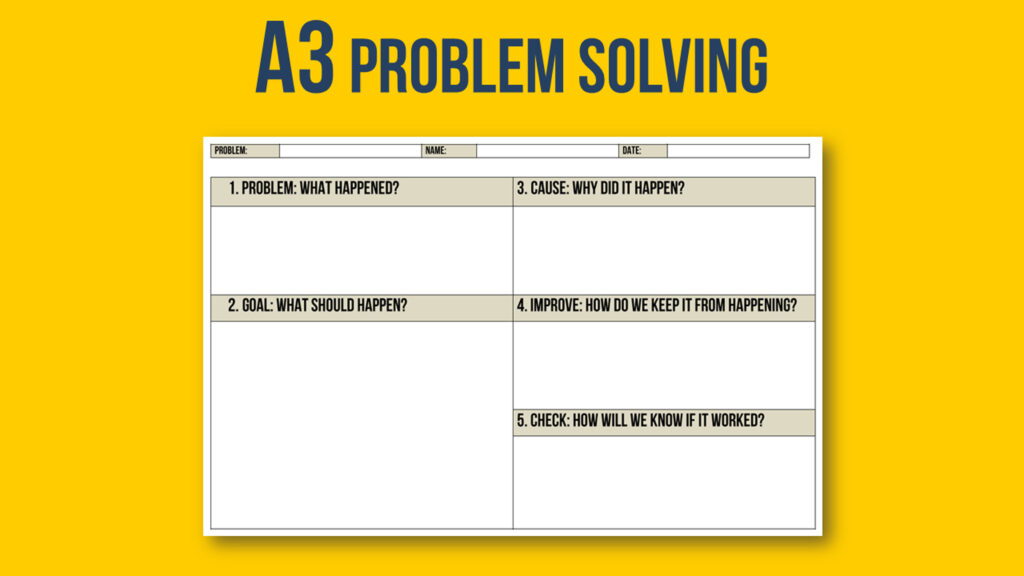
Effective problem-solving is a skill that can make or break an organization’s success. One approach that has gained widespread popularity for tackling complex problems and…

When it comes to process improvement and data analysis, run charts are an invaluable tool that provides a clear visual representation of data over time.…

In the fast-paced world of business, where decisions are made in the blink of an eye and goals are constantly evolving, organizations are constantly seeking…

When you are looking for tools to supercharge your Continuous Improvement journey, Kanban is one of the first ones that come to mind. At a…

Ensuring quality and efficiency are paramount to any business. However, human errors and mistakes can occur, leading to costly defects, rework, and dissatisfied customers. That’s…
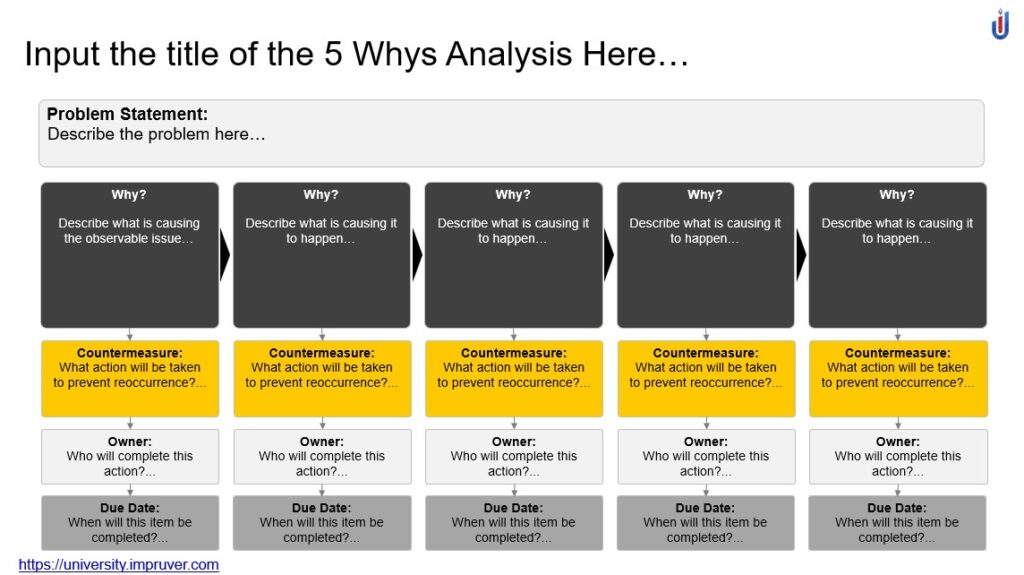
In our quest for improvement and progress, we often encounter problems that need solving. Whether you’re facing a personal challenge or tackling issues within a…

You are probably seeking ways to improve processes, enhance productivity, and foster a culture of continuous improvement. One methodology that has gained significant recognition is…
Please confirm you want to block this member.
You will no longer be able to:
Please note: This action will also remove this member from your connections and send a report to the site admin. Please allow a few minutes for this process to complete.